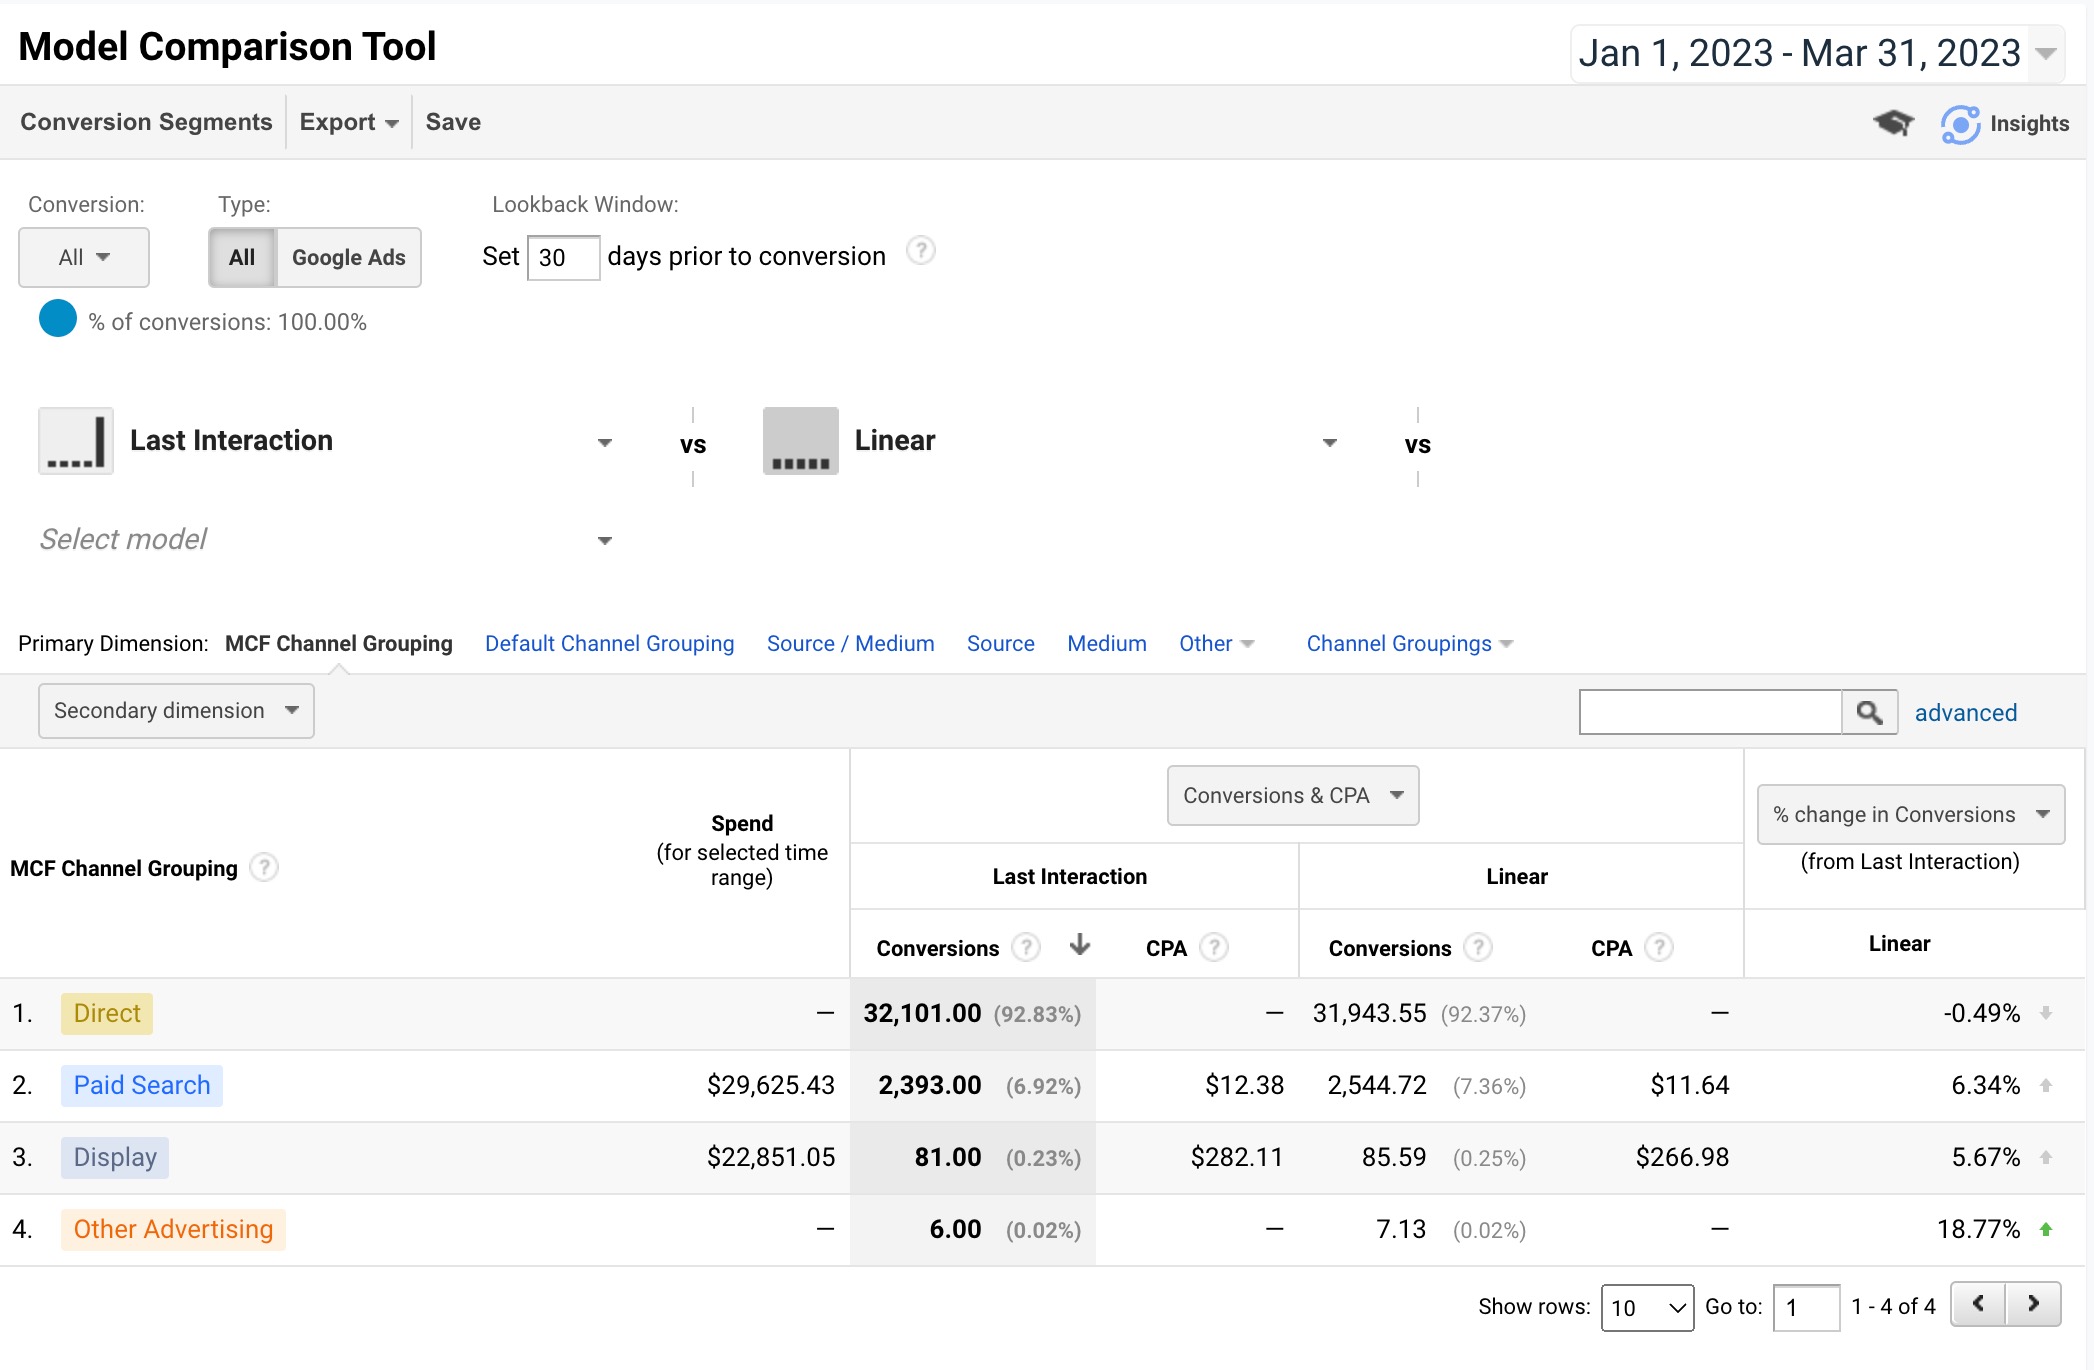
Not everyone needs to be concerned with multi-channel attribution. If it makes up a very small part of your business, it might not be worth it. However, if you want to get a better understanding of the value of your traffic channels and the transactions/revenue they bring in, you might want to give it a go.
R
R is a statistical programming language. It is the most useful programming language for exploring, understanding & visualizing data.
How to Analyze Your A/B Tests Using R
A/B tests are one of the best ways to optimize your website. However, it is not a magical cure for websites that are:
- Poorly Conceived – Website is off-brand or there is a major disconnect with users.
- Poorly Designed – Website is designed in a way that is hard to maintain/confusing.
- Poorly Developed – Website has a lot of code bloat or inefficient code.
- Using Sub-Par/Inflexible Technology – Website is created with technology that allows for very little optimisation or growth.
Creating a Predictive R Shiny App For Google Ads
In this post I am going to go through the code for a relatively simple R Shiny app. It will predict Google Ads transactions and CPA (cost per acquisition). This will be for three months plus the current month. I will add a graph and a table of values, as well as four sliders. These are to adjust spend for the current month and the following three months. You’ll have to experiment with the app to get it to run the way you would like.
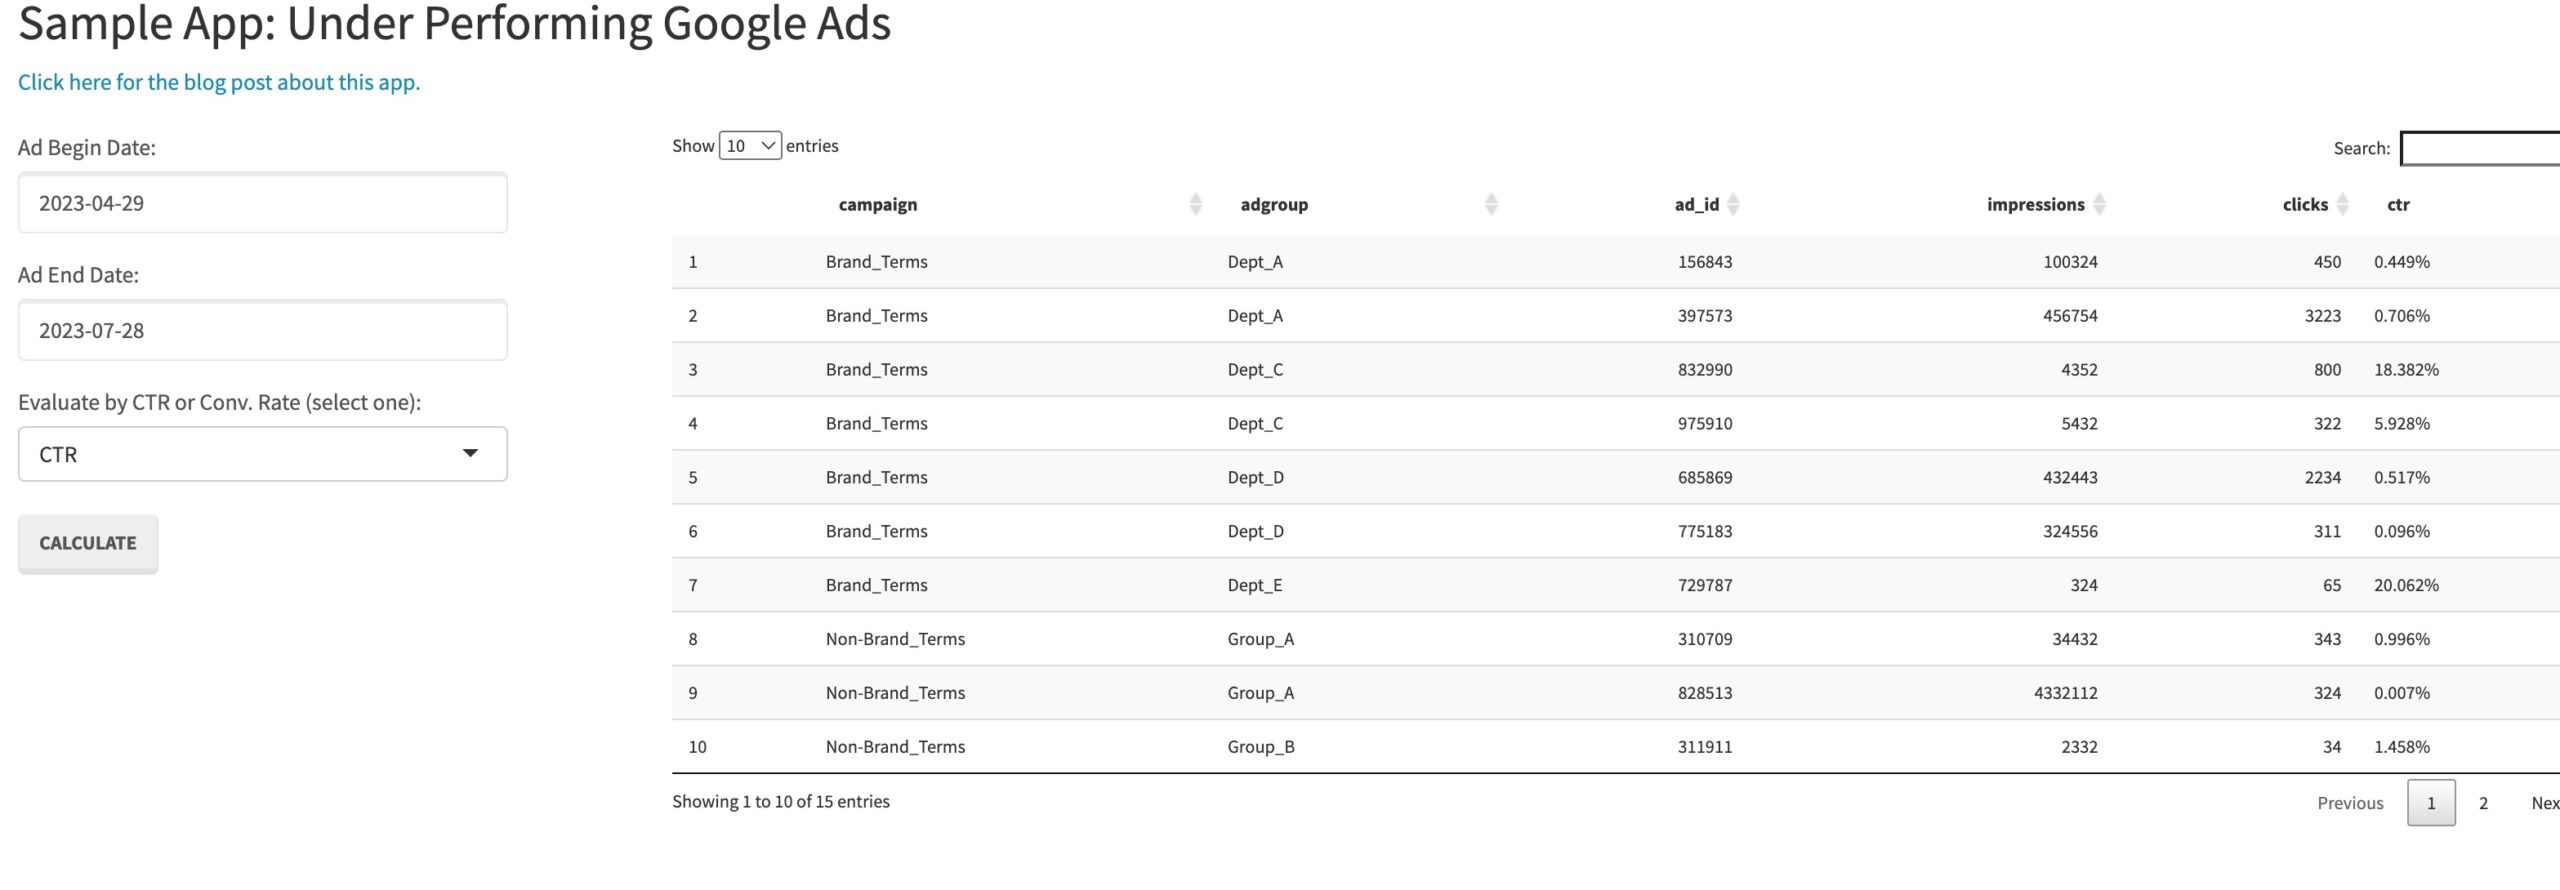
How to Use R to Identify Poor Performing Google Ads
It can be a challenge to identify poor performing Google Ads. R can help by using statistics to find ads that should be replaced.
Replacing Excel With R
Excel is great for spreadsheet use. R is great for data analysis, reporting, data visualization and modeling. I can remember taking accounting in college, when I was not aware of Excel (it was a long time ago). We used sheets of paper that we had to adjust manually (erasers were invaluable). Some of the figures were adjusted so many times, that the paper would wear through.


