Time Series Analysis For Digital Analytics in R (Pt. 3)

Introduction Time-series analysis is a powerful way to predict events that occur at a future time. In this post I am going to be following up from three previous posts (Pt 1 –> https://rebrand.ly/l1tf4p1, Pt 2 -> https://rebrand.ly/zjgpw8v and Introduction to Time-Series –> https://rebrand.ly/z4lomwu). In Pt 2, I used a dummy dataset to show how to create an ARIMA … Read more

Time-Series Analysis For Digital Analytics in R (Pt. 2)

Introduction Time-series analysis is a powerful way to predict events that occur at a future time. In this post I am going to be following up from two previous posts (Pt 1 –> https://rebrand.ly/l1tf4p1 and Introduction to Time-Series –> https://rebrand.ly/z4lomwu) and I’m going to mainly use the forecast package to explore an ARIMA time-series model in R. Retrieving … Read more

Time-Series Analysis For Digital Analytics in R (Pt. 1)

Introduction Time-series analysis is a powerful way to predict events that occur at a future time. One of the most common uses in eCommerce is for sales events. In this post I am going to use the forecast package to explore an ARIMA time-series model in R. I have covered what an ARIMA model is … Read more

Introduction of Time Series Analysis For Digital Analytics

time series

Let’s say you want to forecast future revenue. You could fill in a month-to-month or week-to-week spreadsheet template. However, these are very subjective methods of trying to predict the future and often wildly inaccurate.

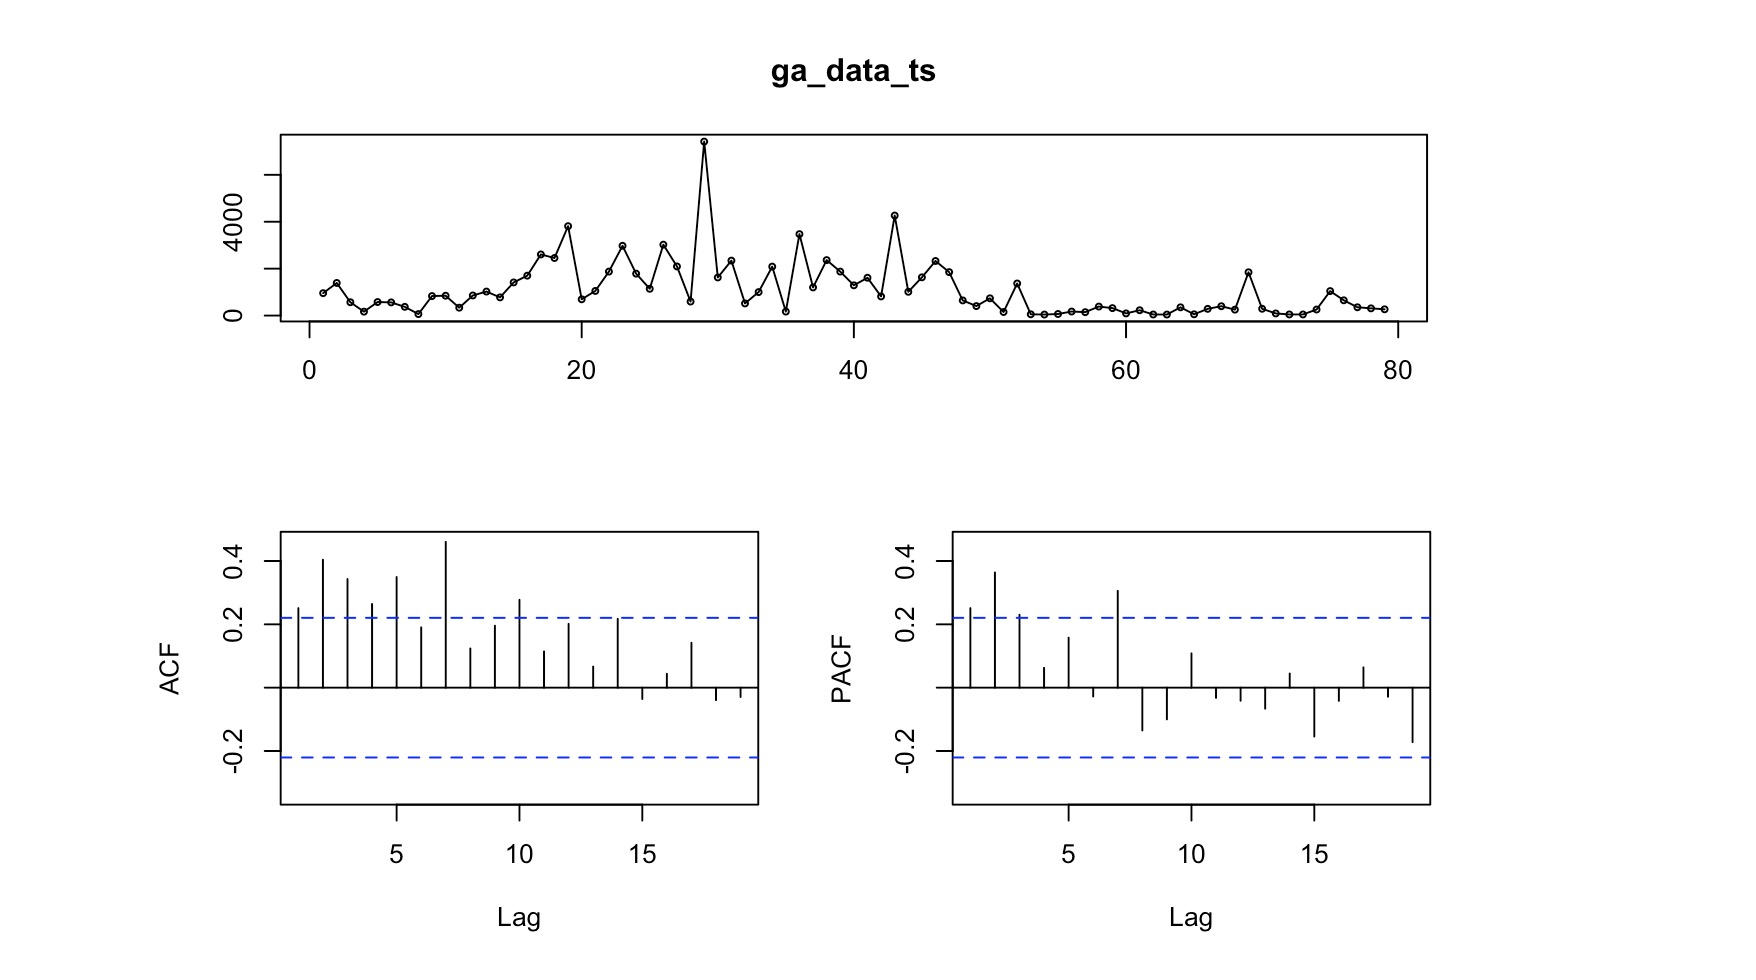
A better method would be to create predictive models using time series analysis. Time series predictive models are a specific subset of statistical models that deal with data that are ordered by and dependent on time. On a graph, the x-axis would be time, with the y-axis the thing (revenue, in this case) you are measuring.

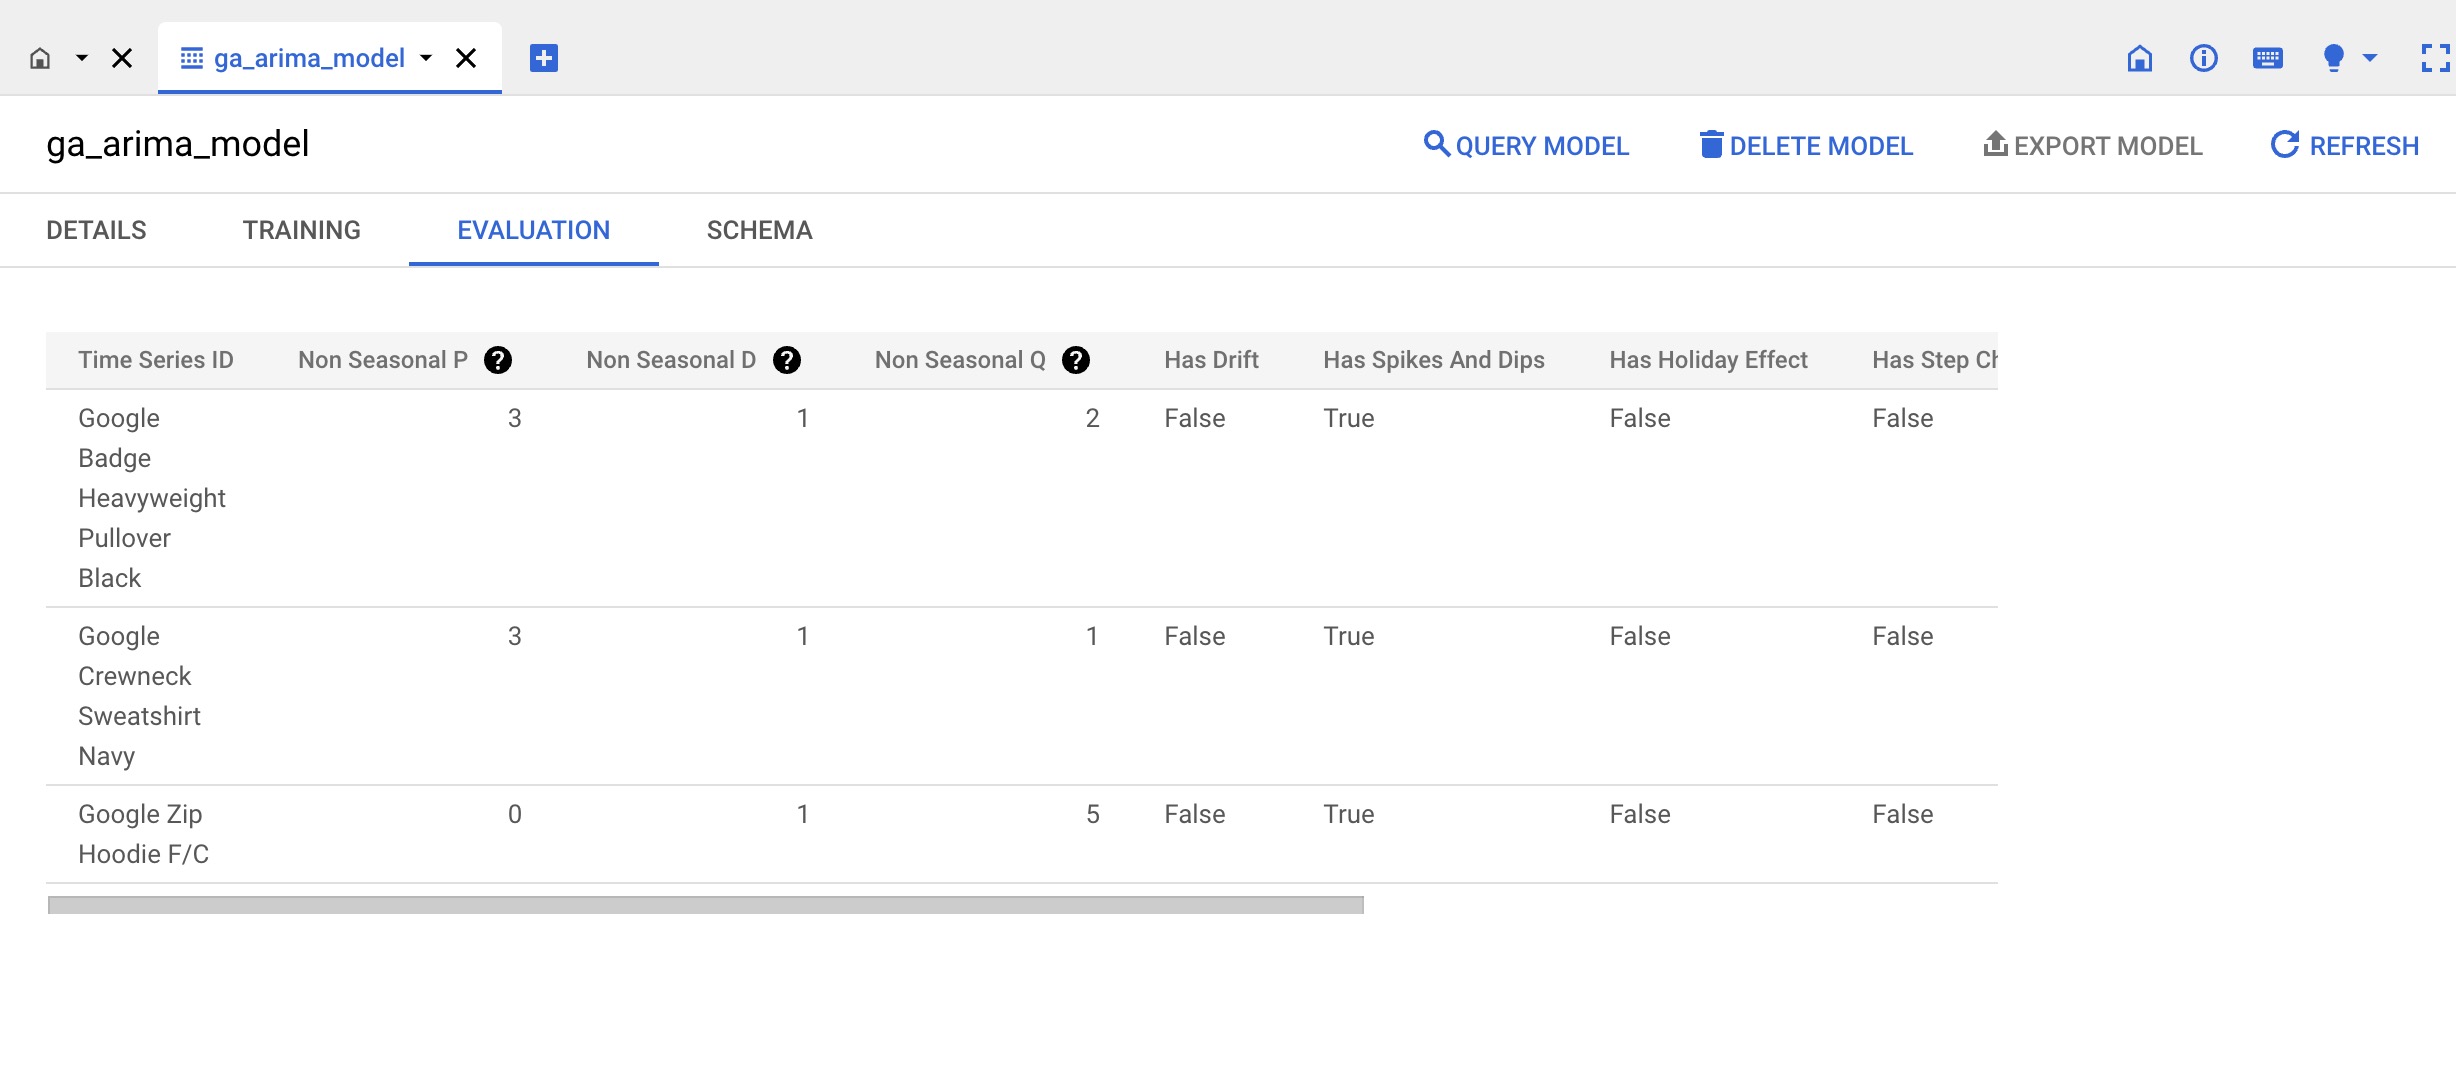
In this post, I will give an overview of one type of time series models and describe how they work in simple language. I will describe how to implement the models in BigQuery ML. 

Read more

Creating a Predictive R Shiny App For Google Ads

Google Ads

In this post I am going to go through the code for a relatively simple R Shiny app. It will predict Google Ads transactions and CPA (cost per acquisition). This will be for three months plus the current month. I will add a graph and a table of values, as well as four sliders. These are to adjust spend for the current month and the following three months. You’ll have to experiment with the app to get it to run the way you would like.

Read more